The Key to Sprint Success? Your Sprint Structure

Does your team struggle to deliver sprints on time?  Do you often have to split stories or determine what to do with major bugs at the end of a sprint?

The Structure of a Typical Sprint.

The Structure of a Typical Sprint.  When you understand the key activities within your sprint, you can choose a sprint length that increases the chance of consistent sprint success, with fewer bugs and fewer incomplete stories.

If so your issue may not be your process or your team but instead your sprint structure. Let’s look at this common issue in more detail. (Note: Going forward click on graphics to enlarge them).

How Did You Determine Your Sprint Length?

The current thought in the Agile community is sprint length should be somewhere between 1 and 4 weeks.

The current thought in the Agile community is sprint length should be somewhere between 1 and 4 weeks.

Many teams pick a sprint length based on what other teams or companies are doing, or based on a length their instructor suggested during Scrum training.  We often choose a length quickly because we want to get started using Agile as soon as we can.

I believe you should be more thoughtful on deciding your sprint length, as the sprint length is at the foundation of your entire Agile process.

Let’s look at ways you can choose a sprint length that will increase your chances of delivering sprints successfully on a continuous basis.

Start By Remembering What We Are Trying to Accomplish with Sprints

You are probably well versed on what sprints are and why we do them, but here is a quick review on sprint basics and how we use them to determine sprint length.

To help you determine how long you will need for a sprint, define what sprint complete, or done, will mean.  Teams often keep the definition of done on a team room wall.

To help you determine how long you will need for a sprint, define what sprint complete, or done, will mean. Teams often keep the definition of done on a team room wall.

Sprints deliver a potentially shippable increment of software every few weeks.  This does not mean every sprint has to be deployed to your production environment, but the stories should not be missing anything to make them production worthy.  “Production worthy” often means:

  • Story is complete
  • Story passes unit tests
  • Story passes functional tests
  • Customer approved the story
  • Story passes non-functional tests (e.g. performance, security)
  • Story integrates with the existing code base
  • Supporting documentation is complete

How long does it typically take your team to get a subset of stories to this level of completeness?  This is your first clue as to how long your sprints should be.

How Long Will You Need for Sprint Planning (at the start)?

Perhaps the most overlooked part of sprints is sprint planning.  Agile teams often rush to start a sprint even when the goals are unclear.  We do sprint planning because the goal is not to start a sprint as soon as we can, but rather to finish a sprint as soon as we can.

Perhaps the most overlooked part of sprints is sprint planning. Agile teams often rush to start a sprint even when the goals are unclear. We do sprint planning because the goal is not to start a sprint as soon as we can, but rather to finish a sprint as soon as we can.

I often find that teams do high level story point estimation and load their sprints based on how many story points they average per sprint.

In my opinion story points only tell us which stories go into sprint planning. During sprint planning the team will break down the work to the point of understanding what each functional area or individual has to do at the task/hour level.  You should allocate enough time to plan your sprint with confidence as opposed to trying to start coding as soon as you can.  

It typically takes 1 to 2 days to understand the work well enough to commit with confidence.  Your sprint length should include the time needed to plan the sprint effectively. [Note that many companies I work with consider sprint planning to be a non-value add activity.  In reality this portion of a sprint may be more important than the coding and testing.  This activity ensures we are clear on what the customer needs before we begin and commit to construction.]

How Long Will You Need for Sprint Adapting (at the end)?

Most teams need 1 to 2 days to wrap up a sprint at the end.  Wrapping up often includes:

  • A demonstration to the customer or subject matter experts

    Determine how much time you need to wrao-up at sprint at the end, and include this time in determining your sprint lenght.

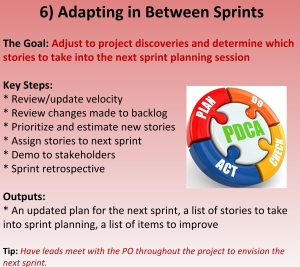
    Determine how much time you need to wrap-up at sprint at the end, and include this time in determining your length.

  • A review of sprint deliverables and project status with key stakeholders and executives
  • A review of the team throughput (velocity) for the sprint
  • A review of new stories that were discovered during the sprint
  • A review of stories that did not get completed during the sprint
  • A review of open bugs from the sprint

If your projects or releases are not too complex, for example if you are mainly delivering enhancements to an existing platform, the adapting practices can often be completed in 1 to 2 days.  On complex projects that span time zones or larger teams, sprint adapting and reviewing can run from 2 to 4 days.  Adapting is considered part of a sprint so make sure your sprint length includes reasonable time for these activities.

Other Items to Consider When Determining Your Sprint Length and Structure

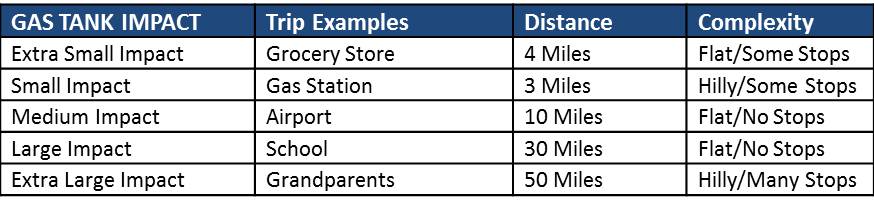
I often use the table below to help clients choose an initial sprint length.  Note that I say initial because your first sprint will be your best indicator of whether you have chosen the correct length.  If you struggle to deliver production ready code you have probably chosen a length that is too short.  This is the most common issue I see with clients.

Use These Questions to Help You Determine the Length and Structure of Your Sprints

Use These Questions to Help You Determine the Length and Structure of Your Sprints.  Click to enlarge.


The Final Product

When you have completed the steps above you should end up with a sprint structure like the one below.  The structure will be dialed into a sprint length and sprint activities that set your team up for success.

Example Sprint Structure

Example Sprint Structure

Feel free to contact me if you would like guidance on establishing your sprint length and structure.

Posted in Uncategorized | Leave a comment

Seven Steps to Remarkable Retrospectives

A team reviews and priorities the issues uncovered during a retrospective.

Figure 1: A team reviews and prioritizes the issues uncovered during a retrospective.

When is the last time you went to a project or sprint retrospective and you walked away feeling like something was accomplished?  Effective retrospectives are an anomaly, and we rarely walk away feeling like anything is going to improve.

In my experience poor retrospectives are due to two reasons:

  1. Attendees need time to warm up and only get to the heart of the issues as time runs out on the retrospective meeting.
  2. We have too many things to improve, so we don’t improve anything.

You can address these key issues with seven simple steps.

Step 1:  Pre-Survey

Since it takes time for a team to warm-up during a retrospective, you can turn the burners on a little early by having the team complete a survey before they come to the retrospective.  I suggest doing this within two days of the actual retrospective meeting.  This will help the team remember the project issues before they come into the meeting, and start productive conversations earlier.

A pre-survey of the team sets the mindset for the retrospective.

Figure 2:  A pre-survey of the team sets the mindset for the retrospective.

Note:  I allow retrospective attendees to respond anonymously if they prefer.  My main goal is to discover perspectives on what went well and what went poorly on a project, I am not so concerned with who said it.

Step 2:  Summarize the Survey and Send it to the Team Before the Retrospective Meeting.

Once you have the survey responses from everyone, summarize the findings.  Since retrospective meetings often run out of time, I highlight the areas I consider most important to cover.  I usually focus on two areas:

1)      An area or process that a large portion of team members have pointed out as an issue

2)     An area that everyone felt we did well on.  Although we usually associate retrospectives with improving, we also want to note what we are doing well and ensure we maintain effectiveness in those areas.

Figure 3:  Summarized survey results can be emailed back to the team after they complete the survey.  Bold tells the team we will cover these areas at a minimum, during the retrospective meeting.

Figure 3: Summarized survey results can be emailed back to the team after they complete the survey. Bold tells the team we will cover these areas at a minimum, during the retrospective meeting.

Once you have summarized the survey responses and the key areas you are going to focus on, you can publish this information back to the team.  By sending this to the team in advance you let them know the areas that will be covered thoroughly, even if we run out of time to discuss each survey response.

Step 3:  Start the Meeting and Go Over the Details of the Key Issues

Start your retrospective meeting by reviewing issues that the team emphasized in their survey responses.  Often the discussion will lead to a deeper and more consistent understanding of what went wrong.  I often have a comment area for each question on my surveys, and the comments can help start the dialogue as each item is discussed.

Figure 4:  If you capture comments on your surveys you can review those comments during the retrospective to get the juices flowing.

Figure 4: If you capture comments on your surveys you can review those comments during the retrospective to get the juices flowing.

Step 4:  Finalize Your List of Most Important Issues to Resolve

Assuming you have a 2 hour meeting for your retrospective, you could spend the first hour going through the detailed issues, and then you could spend 30 minutes boiling the list down to 5 or 10 issues that had the most impact on the project or sprint.  Figure 5 shows a top 10 list of issues that the team has reached agreement on.

Figure 5:  You may have numerous issues discussed during your retrospective, but you need to slim this list down to what is most important to resolve.  In this example the team has reached agreement on a top 10 issues list.

Figure 5: You may have numerous issues discussed during your retrospective, but you need to slim this list down to what is most important to resolve. In this example the team has reached agreement on a top 10 issues list.

Step 5:  What are the Root Causes?

If you are a business analyst you know that we are often asked to address a specific need which is really a symptom, and not the true root need or issue.  The same is true in retrospectives.  We may come up with a list of issues and try to solve each one, but if we look a little deeper we can often see root causes for each item.  In our list of ten items, the team has discussed each one from a “peel the onion” perspective, and they have identified 5 root causes.  You can see the root causes they uncovered in Figure 6.

Figure 6:  A team identifies 5 root cause for the top 10 issues they experienced during the last sprint or project.

Figure 6: A team identifies 5 root cause for the top 10 issues they experienced during the last sprint or project.

Step 6: Use Pareto Analysis to Find the 80/20 Root Cause

Are you familiar with Pareto Analysis?  You may know it better by the common term used for it, the 80/20 Rule.  The 80/20 rule states that 80% of all of our issues are caused by 20% of our root causes.  In our example, the team has identified 5 root causes.  In theory one of these root causes (20% of the 5 in in total) is responsible for 80% of our issues.  In our example the team has cross referenced each root cause to the issues it correlates to, and found that one root cause, distributed team members, is associated with 80% of our top 10 issues.

This would tell the team that if they can only address one item in the forthcoming sprint, that item should be distributed team members.   The return on investment will be the highest if we resolve this one root cause.

Retro Final 2

Figure 7: One root cause is contributing to 80% of the high priority issues.

Step 7: Identify Corrective Actions for the Forthcoming Project or Sprint

Once you have identified one root cause, such as distributed teams, you can have the team brainstorm on corrective actions.  I usually do this in the last 30 minutes of a 2 hour retrospective meeting.  In figure 8 you can see two changes the team is going to make to address the main root cause (distributed teams) that is impacting team performance.

Figure 8:  A list of corrective actions for the forthcoming sprint or project.

Figure 8: A list of corrective actions for the forthcoming sprint or project.

When I walk team members through the process covered in this article, they will often tell me “good job of identifying things to change, but we will get busy on the next sprint and forget we are supposed to make these process changes.”  I agree.

So how do we prevent all of this good retrospective work from falling through the cracks?  We prevent out of sight, out of mind by ensuring transparency on these improvement items.  My suggestion is to add the improvement list to your Scrum wall, so people see it every day during the daily stand-up meeting.  If you do not have a team wall, I suggest option # 2, demonstrated in figure 9.

Figure 9  Do your retrospective improvement items fall through the cracks?  Many teams put the list in place where it cannot be missed.

Figure 9 Do your retrospective improvement items fall through the cracks? Many teams put the list in place where it cannot be missed.

Summary

Retrospectives tie up valuable resources for your team. Do everything you can to make sure value is obtained from your retrospective.  Avoid letting the meeting turn into a complaint and venting session, and concluding with nothing tangible.  If you follow the process outlined in this article you should be able to drive improvement into your projects, which in turn will increase the enthusiasm and contribution in your retrospectives.

Posted in Uncategorized | Leave a comment

Are You Writing Checks Your Team Cannot Cash? Here’s How to Stop Over Committing on Sprints

Are you overloading your sprints?

Are you overloading your sprints?

One of the top 5 mistakes Agile teams make is to over estimate how much work they can deliver in sprint.

Is this due to customer pressure, a desire to please, a hero mentality, or pressure from a manager?  I see all of these items being a factor, but I believe the main issue is a lack of knowledge.  Specifically, teams are bypassing a critical process, sprint planning.

In my experience teams often talk about story points and how they use them to estimate project releases and sprints.  You can see how story points are used to create release plans in my previous article here.

The disconnect usually comes from the fact that Agile teams often assume that story points are the only way you estimate how much work can be completed in a sprint.  In reality, story points are only used to determine which stories to take into sprint planning.  At the conclusion of sprint planning we have identified and estimated all known tasks needed to deliver each story, and we compare that to true team member availability.

A Big Picture Perspective of the Agile Lifecycle.  Teams often skip sprint planning, which increases the probability of over committing.

A Big Picture Perspective of the Agile Lifecycle. Teams often skip sprint planning, which increases the probability of over committing.

At this point the team makes the decision on whether the work will fit, and whether they will commit to the stories scheduled for the sprint.  They have much more detailed information to make a commit decision with.  Whereas story points indicate impact to the whole team, sprint planning identifies impact to each individual or functional group.

To understand this better, let’s look at an example of how we do sprint planning.

Sprint Planning Overview

If we go back to my previous article, we had a release plan based on how many story points we believed we could complete in a sprint.  See figure 1.

Figure 1 - Based on estimated story point velocity, a release plan shows stories target for sprints.

Figure 1 – Based on estimated story point velocity, a release plan shows stories targeted for sprints.

We estimated story point velocity to be 25 points per sprint, so each sprint has 25 points or less assigned.  In sprint 1 we assigned 22 points that tie directly to 4 user stories.  At this point most teams stop.  The team assumes they can do the 4 stories and they start sprint 1.  This is a huge reason why teams over commit on sprints.

Story points are used for high level estimation and for long term planning.  They are a starting point in the planning process and they make perfect sense for estimating how many sprints will be needed for a project.  They estimate effort needed by the whole team.

But if the team is going to commit to a sprint, meaning to provide a personal promise, then they should understand what they are personally being asked to deliver before they make a commitment.  We do this by performing detailed planning for a given sprint.

The steps for detailed sprint planning are:

  1. Identify the stories to bring into sprint planning
  2. Design each story
  3. Identify and estimate the specific tasks for each team member
  4. Determine team member availability during the sprint
  5. Compare the task estimate to team member availability
  6. Team makes a commitment based on whether the work fits

Let’s look at each step.

Sprint Planning in Detail

Step 1:  Identify the stories to bring into sprint planning.

This is relatively easy.  The release plan you have already created indicates which stories to plan for the sprint.

Step 2: Design each story

Figure 2 - A team designs and plans each story in detail during sprint planning.

Figure 2 – A team designs and plans each story in detail during sprint planning.

Designing a story usually means finalizing the coding approach and the visual design.  An overall, high level design for the project was created during release planning.  Sprint planning builds on this foundational design, with specific details for each story.  If you are familiar with JAD (Joint Application Design), you will find sprint design work to be very similar. You will leave sprint planning with detailed screen, coding design, and acceptance criteria for each story.

Step 3 : Identify and estimate the specific tasks for each person

After the design is finalized, each team member should identify their tasks, and how much work they need to do to support each story.  Here is what the task list and estimates might look like after planning all of the stories in a sprint.  See figure 3:

Figure 3 - A team identifies and estimates all of their tasks for a given sprint.

Figure 3 – A team identifies and estimates all of their tasks for a given sprint.

Step 4:  Determine team member availability during the sprint

Once we know how much work is needed, we need to determine how much time each person truly has available to work on the sprint.  To keep our example simple, we will assume that our example team performs one week sprints.  One week usually means 40 hours of work.  So for each team  member we should have 40 hours for each of them to deliver their tasks.  If you look at the task estimates in table figure 3, no one has more than 34 hours of work to do, therefore we could assume that the work fits and we can start the sprint.

But in the real world we know this is not true.  We have vacation, illness, production issues, training, company meetings, and so forth.  In sprint planning we do not pretend these issues do not exist, we bring them into the availability equation.  Figure 4 shows the true availability for our team in the week targeted for the sprint.

Figure 4 - A team determines their true availability for a sprint.

Figure 4 – A team determines their true availability for a sprint.

Step 5:  Compare task estimates to true team member availability

Now if we compare the work needed to the actual time available, we can see if the work fits.  See figure 5.

Figure 5 - A team compares work estimates to availability to see if the work will fit  into the sprint.

Figure 5 – A team compares work estimates to availability to see if the work will fit into the sprint.

In our example it looks like Sanjeev’s work should fit within his availability, Keith’s work loads him up to his capacity, Diane’s work should fit her capacity, and Paul is 9 hours short of the time needed to do his work.

Step 6:  Team makes a commitment depending on if the work fits

Once we have the information in figure 5 we would share it with the team and then each team member can say whether the work will fit into their availability.  The table is only a tool to help with the decision.  A team member can disregard what the table implies.  For example, Sanjeev could state that he does not think he can complete all of his work within the sprint, even though the table implies he has capacity.  Conversely, Paul can decide to go forward with the work, even though it looks like he is 9 hours overbooked.  Paul might explain that there are economies of scale, and some tasks are easier to do if he is already in the code doing work.  So he will commit to the work even though the table implies he may be overbooked.

Ultimately, the decision to commit is a team decision, and if the team does not support the workload, we remove stories or tasks until they can commit.

Summary

Many Agile teams do not break their work down to the task level, or review their availability, before they commit to a sprint.  By skipping this step they often overload a sprint and end up delivering short.  If this becomes a habit, the business and stakeholders will lose faith in the team and their ability to deliver.  Take the time to do sprint planning and increase your chances of completing your sprint on time.

Posted in Agile Practices | Leave a comment

Your Car Can Show You How Agile Estimation Works

P90064037

Agile estimation is similar to how your car calculates your range on a tank of gas.

I obsess on watching the mileage my car gets.  Every time I fill the tank I note how far I traveled on the last tank, and then I try to break that record with my new tank of gas.

As I have experimented with trying to get more from a tank of gas I have learned one key thing:  The only part of the equation that is a constant is how many gallons of gas my tank can hold. How far I get on a tank of gas can very significantly depending on the kind of trips I go on.

For instance, if I strictly take my daughter to school via the freeway, I get really good mileage, but it is a 15 mile trip each way.

If I make a trip to the grocery store it is only 2 miles each way, but it is in the city and I have several stops and delays on the 2 mile journey.  I burn a lot of gas sitting at redlights.

If I go to the airport it is about 10 miles, and also on the freeway without any stops.

I started watching my gas gauge and miles remaining after each trip.  After a while I was able to identify patterns and categorize my trips into the impact they had on my tank of gas.  Chart 1 shows the impact by trip type.

Chart 1 – How different trip types affect the amount of gas left in the tank.

Chart 1 – How different trip types affect the amount of gas left in the tank.

After I identified the patterns, I started wondering if I could assign a weight to each type of trip.  The weight would tell me the impact each trip had on my tank based on a weighted scale.

To do this, I decided to establish trip points.  I would rate each trip with a weight that correlated to its impact to my tank of gas, and it’s relative size to the other trips.  Chart 2 shows the system I came up with. (note that trip points are not directly correlated to miles traveled)

Chart 2 - Trip distance and complexity has a direct correlation to how much gas is used in my tank.

Chart 2 – Trip distance and complexity has a direct correlation to how much gas is used in my tank.

If you review chart 2, you can see that I believe a gas station trip hits my gas tank twice as hard as a trip to the grocery store, and a trip to the airport hits my gas tank twice as hard as going to the gas station, and so on.

My gas tank has fixed capacity, and that fixed capacity can support a limited amount of trips.  How many trips is determined by their distance and complexity.

My gas tank has fixed capacity, and that fixed capacity can support a limited amount of trips. How many trips is determined by trip distance and complexity.

Using this scale I created, I started measuring how many total trip points I was getting per tank of gas.  After running through approximately 3 tanks of gas, I saw that I averaged 40 trip points per tank.  The types of trips I did could vary, but consistently I saw that I was out of gas when I was around 40 trip points. In essence, a tank of gas was worth 40 trip points.

Using this information, I decided to forecast how many tanks of gas I would go through based on the trips I anticipated taking in the future.  I created a diagram that shows how many tanks of gas I will need. Note that each trip has its estimated trip points listed to the left.  See the diagram below.

Based on how many trip points I average per tank, I can forecast how many tanks are needed for my future trips.

Based on how many trip points I average per tank, I can forecast how many tanks are needed for all of my forecasted trips.

When I was done, I could see that I would need 4 tanks of gas for my forecasted trips.

So how could we correlate this approach to software project estimation?

First, in software development, our “trips” are user stories.  And similar to the process we used on trips, we have the team look at each user story and determine its impact to a sprint.  In software development, a sprint is our “tank of gas”.  Let’s look at an example.

List 1 - A list of user stories for our project. How many tanks of labor (sprints) will we need to deliver them?

List 1 – A list of user stories for our project. How many tanks of labor (sprints) will we need to deliver them?

If we were building an online auction system, our list of user stories might look like the stories displayed in list 1.

And similar to our trips, each story could be sized.  We size trips by distance and trip complexity (number of stops, terrain).

We size stories by the amount of code we expect to write and test, and how complex each story is (does it requires an interface?  Have we ever written this type of code before?).

Table 1 below shows how a team could have went through and sized our list of stories for a project, based on how much coding and testing the story will need, plus the complexity of the story.  The team discusses each story and based on their perception of coding/testing size, and how complex the story is, they establish story point values for each story.

Table 1 – A list of user stories (backlog) is rated for coding/testing size and complexity.

Story point values are our estimates for how much impact each story will have on a sprint. So once we know the size of our stories, we need to know how many stories we can get from a tank of gas.  For software teams a tank of gas is a sprint.

In our example, we would ask the team to go through a few sprints so we can determine how many story points they would average per sprint.

A team does this by typically guessing, usually a quick discussion, of how many stories they think can complete in a sprint, and they do the sprint to see how many they can actually complete.  After a few sprints they usually have a good average they can use for future planning.  In Agile terms we call this average throughput per sprint velocity.

For the purposes of this article, we will assume this team has worked together before, and they know how many story points they average as a group.  For our example, we will say they usually average 24 story points completed in a sprint.   So the team plans each sprint, so that it holds no more than 24 story points.  They do agree to make an exception in sprint 3, and allow 25 story points to be assigned to that sprint.  You can see their plan in the diagram below.

Release Plan Diagram - Based on how many story points they deliver in the average sprint, the team forecasts how many sprints will be needed for all of the stories in the backlog.

Release Plan Diagram – Based on how many story points they deliver in the average sprint, the team forecasts how many sprints will be needed for all of the stories in the backlog.

When teams assign stories to sprints, the Agile term is called creating a release plan.

Hopefully this example made it easier for you to understand how high level, relative estimation works in Agile projects.  Feel free to drop me an email or leave comments if you have a question.

Notes:

  • On an actual project we would probably use the Fibonacci sequence for our story point scale.
  • On a real project we may have a rule that any story larger than 8 points must be broken down into smaller stories.
  • Agile story point estimation is dependent on constants.  Just as your trip computer does not expect the size of your gas tank to ever change, estimating story point requires that your team size and sprint length stay the same.  If you change either item you must run  a few sprints again to reset your baseline for story points you usually complete in a sprint.
Posted in Agile Practices | Leave a comment

Seven Common Mistakes with the Daily Stand-up Meeting

A Daily Stand-up Meeting. Who says stand-ups are just for software teams?

The daily stand-up meeting, also known as the daily scrum, may be the best of all of the agile practices.  Why?  Because it meets three criteria:

  1. It’s easy to start using
  2. It can often be used without other agile practices
  3. It provides great value

Stand-ups can be interjected into waterfall teams and they can be used without converting to iterations or other common agile practices.  From an adoption perspective, the resistance to using stand-ups is low.  From a value perspective, teams quickly see the how the stand-up identifies risks and issues early. The stand-up gives them more time to react and still hit their goals.

As good as the stand-up meeting is, if done incorrectly it can do more harm than good.  As an agile coach I have found I often skimp on stand-up training because it seems so simple.  But this skimping has come back to bite me several times.  How have I been bitten?  By the seven common stand-up mistakes below.

Mistake # 1 – Not Standing (the daily sit down)

Sitting takes the energy out of the daily stand-up.

Teams usually stand when they first start doing the daily stand-up because they have just came out of agile training and they were taught to stand.  But as time progresses it is common for some teams to assume standing is a formality and they start sitting more and more. This is especially common if the meeting is in a conference room where chairs are available.

Standing is not a formality but rather a key success factor in establishing collaboration and keeping the meeting short and effective.  How can you keep the team standing?  Here are some tips that usually help:

  1. Try to do the stand-up where chairs are not available.
  2. Keep the team focused on the three key questions:  What did you do since we last met?  What will you do between now and the next meeting?  Do you have any blockers or constraints that are impeding your progress?  It is common for team members to explain their impediments in detail, and for a dialogue to start up between a few team members on how to resolve the impediment.  This is fine if a solution is agreed to in a few seconds, but usually this a long conversation that ties up the whole team when only a few team members are needed.  So as a Scrum Master, coach, or team member, get select team members to work impediments together after the stand-up.
  3. Use a physical status wall (covered in mistake # 5 below).

Mistake # 2 – Team Members Not Showing Up On Time

Many teams struggle with team members drifting into the stand-up, often 5 to 10 minutes late.  This contributes to the issue noted above, not standing, but also demonstrates a lack of personal discipline.  Here are some tips for addressing the late arrival issue.

  • Pick a time of day that the team all agrees to, to have the stand-up.  Sometimes management will ask the Scrum Master to have the team meet at a certain time, but I have found it is better to meet when everyone has arrived at work, and at a time the team all agrees to.
  • Get support from line managers.  Agile is about team self-management and self-discipline, but everyone does not arrive at this state at the same time.  If you are a Scrum Master, work with all of the managers who team members work for, and get agreement that the daily stand-up is important, and that punctuality is important.  Line managers can emphasize these values when they do one on ones with their team members.
  • Provide a buffer between meetings that occur before the stand-up.  If there is another meeting that precedes the stand-up, make sure the stand-up is not scheduled when the other meeting ends.  Instead add a buffer of 10 to 15 minutes so that the stand-up is not impacted by any upstream meetings that runs over.

Mistake # 3 – Allowing Distractions

Daily stand-ups are ineffective if the team is not focused during the stand-up.  Here are some tips for keeping the focus:

Click on the photo to see an example of a bad location for a stand-up.

1)      Location, location, location.  If you do your standup meeting in the wrong location the
team will get interrupted by passers by, or be distracted by eye candy such as the street below.  Pick a location without chairs, some level of isolation, and if possible no windows.

2)      Set a team norm of no cell phones or laptops during the standup.

3)      Focus on good meeting etiquette – no side conversations or whispering.

Mistake # 4 – Updating the Project Management Tool During the Stand-up

Don’t let electronic tools drag down your stand-up.

Are you using an online tool to track project status?  Maybe Mingle, Rally, or VersionOne?  Many times the team will stand idle while someone is updating the tool during the stand-up.  Try to avoid this at all costs.  Have someone take hard copy notes and update the tool later, or even better, use a physical status board and have  team members physically update their tasks during the daily stand-up.  Remember that the tool serves the team, the team does not serve the tool.

Mistake # 5 – Not Using a Physical Status Wall

A good physical status wall gets the whole team involved in the stand-up.

I love electronic project management tools.  They let me consolidate information and do reports across a portfolio of projects.  But the tools can impede collaboration during the daily stand-up.  If one person is projecting the virtual status wall from an electronic tool, and discussing it with the team, the team often becomes an audience and just listens.  However, if you have a physical wall with task cards, team members move and update their physical cards during or before the stand-up, which leads to much richer discussion and interaction.  You can use an electronic tool in parallel (most of my clients do).  It may be a little redundant, but the value a physical wall provides offsets maintaining 2 tools.  And it will lead to a better stand-up meeting.

Mistake # 6 – Not Having a Dedicated Team Room

The team will go through the stand-up meeting quickly if they know they can ask each other detailed questions once they return to their work area.

You may be wondering why you need a dedicated team room for a stand-up.  You do not need a dedicated team room for the stand-up meeting, but you do need one for a good stand-up meeting.  Confused?   Here is the scoop.  If your team is distributed all over your campus, and they come together physically each day for 15 minutes, do you think you can get them to only discuss status?  I have not been successful in doing this.  Developers and testers will want to get into testing details during the stand-up, user experience wants to talk to developers about screen details, and so on.  If you have a dedicated team room, team members can talk about the construction details all day long, and they will not need to deviate from the stand-up status/impediment discussion.

Mistake# 7 – Not Using a Stand-up for Distributed Teams

Stand-ups are harder to perform with distributed teams – but still highly valuable.

Most companies I work with have team members in the United States, India, and China.  These teams will often tell me they cannot do stand-ups because everyone is in different time zones.  I understand this issue but I also understand that we undertake a lot of risk if we do not communicate daily.  To get around this issue I have teams do the following:

  1. Do a stand-up meeting at each location.  At a minimum get team members synchronized at each site
  2. Have one team member from each team work a staggered schedule.  These team members on staggered schedules can do a video call or audio call to synchronize each day, and then take that information back to their local teams.
  3. Use electronic tools to share status details.  Electronic tools really show their value with distributed teams.  Everyone can see the status information around the world, as soon as it is entered.

Follow these steps and you will establish a sound daily stand-up process, which will provide a great foundation for all of the agile practices you use with your team.

Posted in Agile Practices | Leave a comment

Agile Cannot Be Used To Estimate Fixed Bid Projects, Right? Wrong.

Traditional projects often say scope is fixed, and the variables are how long it takes to deliver the scope, and how much the scope will cost.

I have watched numerous presentations contrasting agile to traditional software development.  The story goes like this.  A traditional project is usually scope constrained.  Similar to a fixed bid scenario, we are told what the scope of the project must be, and then we will research the request, estimate the time and cost, and come back with a proposal that includes our price and the date we can deliver on.

Agile projects are stated as being the opposite.  Instead of being scope constrained, we say that agile projects are time and resource constrained.  In the agile example, we say the customer wants as much functionality (scope) as they can get by a fixed deadline, and we can only use the resources, or team members, that we currently have.  The customer is asked to prioritize their needs, and then the agile team will estimate how many of the needs they can deliver by the due date.

Agile projects often say Time and Resources are fixed, and the only variable is how much scope can be delivered by the fixed date with the fixed team.

When I listen in on these presentations I will often see an attendee jot down a note “use traditional for fixed scope, use agile for fixed date projects……..”

But is this true?  No it is not.  Agile works well for fixed scope too.  As a matter of fact, I prefer agile to traditional for fixed scope bidding.  So how would you apply agile to a fixed scope request?  Almost identical to the way we plan for a date driven project.

How the Traditional Fixed Scope Bidding Process Works

Let’s start by looking at the traditional process for bidding on a fixed scope project.  A potential client could ask us for an online auction system that supports mobile devices and allows for 500 concurrent users.  The major features that must be there are auction creation, item bidding, seller feedback, online help, and the ability to search for auctions.

We could meet with our project team and discuss the scope.  The team would break down the feature requests, outline the dependencies and critical path, then estimate the major tasks.  In this example the team comes back and says it is a 12 week project, and 7 team members will be needed.

Our burden rate per team member is $3000 per week, so we determine that our cost to do this project is:   $3000 X  12 weeks  X 7 team members =  $252,000.

We would like to make some profit on this project so we add in another $48,000 for our profit, and we tell the customer, you can have the scope you requested, in 12 weeks, for $300,000.  We have now completed our fixed bid process for this project request.  This is the traditional fixed bid process.

How the Agile Fixed Scope Bidding Process Works

So how could we use the agile process to bid on a fixed scope project?  In summary, we estimate how many iterations will be needed for the scope requested, and what our expense is per iteration.  Let’s look at this in detail.

First, the team obtains the requirements from the customer. The team will review the requirements and if possible ask the client refining questions about the needs, often improving and refining the definition of scope.

When we are done refining our understanding of scope, the agile team discusses the requirements and converts them into user stories, if they are not in this format already.  Once we have the list of needs/stories, the team discusses each story requested, and the new stories are compared to similar ones the team has delivered in the past.  The table below illustrates how this comparison is done.

Comparing new story requests to previous stories delivered is an effective and efficient way to estimate project requests.

In the first example, the new story request, auction bidding, is determined to be about the same size and complexity as create a quote.  Create a quote was delivered by this project team a few months ago and it was sized at 8 story points. So the team estimates auction bidding will also take 8 story points

Teams usually gauge what they deliver in story points per iteration.  So for our example, we will say this team has averaged 20 story points delivered every 2 weeks (a 2 week iteration) on previous projects they have delivered.

In our example, the team totals up the all of the story estimates and it comes to 60 story points for the scope requested.  Assuming 2 week iterations, and the fact that the team averages 20 story points per iteration, the team estimates needing 3 iterations (6 weeks) to deliver the project.

However, an alert Scrum Master notes that the team averages 20 story points per iteration, but they have delivered as few as 15 story points on some of their slower iterations.  The Scrum Master suggests that the team commit to the worst case scenario instead of the average.  The team agrees and uses 15 points per iteration as their estimated throughput (aka velocity) and they tell the customer they can deliver the request in 4 sprint, or 8 weeks.

A team estimates the story points for each story, then looks at their past work to see how many story points they usually deliver in an iteration. The result is a project plan (which agile teams often call a “release plan”).

Once an agile team estimates the number of iterations needed and the corresponding delivery date, we still need to estimate how much it will cost before we price the work.  We do this by understanding what the burden rate is for the individuals on the team (just like traditional), and then totaling that up for 8 weeks of work.

In our example, each team member has a burden rate of $3000 per week, and we have 7 members on the team, and we will need them for a total of 8 weeks (4 iterations), then our cost for the project will be:  $3000 X 7 team members X  8 weeks = $168,000.

To make some profit once again we add in $48,000 and we tell the customer we will deliver the scope they requested in 8 weeks for $216,000.

All of the estimates above assume all team members are 100% allocated to this project.

Summary

This case study makes many assumptions, but hopefully it makes my point clear.  Agile is not limited to time constrained projects.  Agile can be used for any project constraint – scope, resources, schedule, or other.

As mentioned, I prefer using Agile for fixed bid work because I usually find the estimates as good or better than traditional estimation methods.  I also find that the team can usually estimate the work much sooner since they do not break each request into tasks, and estimate at the task level.

Trying to estimate a project request right now?  Drop me an email and I will help you apply this process or answer any questions you have.

Posted in Agile Adoption, Agile Practices | Leave a comment

Summer 2012 – Five Things I Learned as an Agile Coach

The Goal:  Work hard through the spring, then take a few weeks of vacation in the summer.  Reality:  My clients did not slow down for the summer and I found myself even busier than before.  It was a good problem to have and I will find some time this fall to recharge my batteries.

Even better, I learned a lot from my clients this summer.  As a coach I am supposed to “know it all,” but as all coaches know, the learning never ends and we try to get better and more knowledgeable every day.  Here are 5 things I learned this summer.

1) Agile: All or Nothing?

I learned that most folks still view Agile as all or nothing.  I met several clients and students this summer who asked me: “based on my situation, do you think I should use Agile or not?” I am not a believer of Agile, yes or no, but more a believer of “what level of Agile makes sense for this situation?”  As I bounced around the country this summer I continued to promote this mentality.  I spent a good portion of the summer helping companies determine the level of Agile to apply with minimal risk and maximum value.

The question is not “Agile, Yes or No?”, but rather “Agile, how much makes sense for our situation?”

2) Story Points are Still a Hard Sell

Examples can help teams learn how to use story points, but it is an advanced practice that takes time for teams to digest.

The seasoned Agile practitioner understands the value of relative estimation and story points.  I work hard to train the novice on the value of story points, and coach new Agile teams on how to establish reference stories and distribute them across a Fibonacci scale.  I use numerous analogies, demonstrate what other teams have done, and provide hands on coaching.

This usually works.  However, on occasion, (and once this summer) I came across a team where story points were hard for the team to comprehend and apply.  They struggled to use story points consistently and effectively.  I am still coaching this team, and they are getting better.  But as an Agile coach it is important for me to remember that each Agile practice requires a certain level of Agile maturity, and practices such as story points are mature practices that require time and extensive coaching.

3) Agile Can Work in a Regulated Environment

The debate about using Agile in a regulated or governed environment still goes on.  This summer I witnessed Agile working and providing value in regulated environments.  I worked with two great clients who had many regulatory requirements.  Together we created an Agile framework that met all of the compliance requirements, while delivering value sooner, improving customer satisfaction, and reducing waste in their software projects.  Agile and governance are not mutually exclusive, it just takes a little work to get them to dovetail.

Many governing bodies are starting to support many of the same principles as Agile.

4) User Experience is Still Being Overlooked

Several companies I work with have dedicated user experience teams and roles.  The work of these teams is invaluable and the groups are dialed into the target audience and creating a truly intuitive and enjoyable experience for their users.

User experience is important, even if you are constrained by your tools. Great books like “Don’t Make Me Think” can infuse a user experience mentality within a team.

Unfortunately I am mainly seeing a focus on user experience when I work with companies who create their own custom webpages and interfaces.  When I work with teams who have to use an Off The Shelf package for their interface, I rarely see a user experience focus or team.  These teams often believe they have no need for user experience because they mainly configuring a package and have limited control over look and feel.

As most people know, user experience is so much more than look and feel.  There is interaction, there is simplicity of design, there is detailed understanding of the user(s) and their needs, there is a focus on creating applications that are intuitive and easy to learn.  I spent a good part of my summer encouraging clients to put more focus on user experience regardless of team structure or tool limitations.

5) Patience

Agile coaches adamantly tell clients that Agile is cultural, and that moving to Agile takes a lot more than just using the practices.  I say this to my clients, but just like the typical executive I want instant gratification.  This summer I worked with a team for many weeks, and as the summer drew to a close I felt like the team was still not grasping the principles or buying into Agile.

Be patient with your Agile “seedlings”. They will grow with consistent coaching.

As I was slowly drifting into a state of depression about the lack of results, the seeds of Agile, planted in the spring,  began to bloom.  The project teams starting using the practices effectively.  Team members started going beyond memorization and questioning me on the the practices I was suggesting.  Teams started choosing the practices to use based on their situation.  The culture was developing an Agile mentality.  How could I have ever doubted them?

This is a great lesson for me as a coach.  I need to have patience and let Agile “bloom” and try not to force the culture to change based on the calendar.  I need to continue to coach, evangelize and believe, and the change will take hold.

That was my summer.

Now off for a few days of vacation………………….wait……..is that the phone ringing? 

Posted in Agile Adoption, Agile Coaching, Agile Practices, Enterprise Agile, Uncategorized | Leave a comment

Does Your Project Have an Elevator Statement? Did the Chevy Volt?

The Chevy Volt

Recently production was halted on the Chevy Volt due to low demand.  If you are not familiar with the Volt, it is a hybrid car that uses a battery powered electric motor, and has an additional gasoline motor that kicks in when the battery is exhausted.

The concept sounds good.  Everyone wants to be green and drive an electric car, but no one wants to run out of juice and be stranded from their home battery charger.  This anxiety has limited the purchase of pure battery powered vehicles where the typical driving range is 70 miles per charge.

Nissan Leaf

Chevy decided to address the problem by adding the option of switching to gas power if the batteries are drained, and you will never be stranded like you would be in a pure battery car, such as the Nissan Leaf.

When the Volt came out I questioned the level of feasibility work that was done, and how the business case was justified.  I saw the value of the Volt and I was amazed at the technology, but I also perceived many negatives that could limit the buying audience for the vehicle.

I believe that if the correct feasibility processes were performed Chevy may not have gone forward with the Volt.  For the purposes of this article, let’s do a feasibility simulation and see what could have happened at Chevy.

Starting Feasibility with an Elevator Statement
I train teams to start the feasibility process by creating an elevator statement for the project or product.  If you are not familiar with elevator statements, they concisely describe the justification for doing a project, or why this project makes sense to do.  Elevator statements do not discuss who, what, when, or where, but only focus on the business reasons for doing a project.

Elevator statements are brief and can be shared with a fellow elevator passenger in the short amount of time it takes to ride an elevator from one floor to another.  The thought is most people have a short attention span, and if you cannot summarize the value of a project in a concise paragraph, the project may not make sense to pursue.

The format of an elevator statement looks like this:

For (target customer)

Who (statement of the need or opportunity)

The (product or project name) is a (category)

That (statement of key benefit – that is, compelling reason to proceed)

Unlike (primary competitive alternative)

Our Product (statement of primary differentiation)

To demonstrate with an example, I imagine many years ago the Apple iPod may have had an elevator statement that looked like this:

For:     Music lovers

Who:   desire a simple way to listen to and manage their songs

The:    iPod

Is a:     portable digital music player

That:   provides intuitive, easy to use controls.

Unlike: other MP3 players

Our:    product provides seamless integration with a world class music store (iTunes)

So going back to the Volt, what could the elevator statement have looked like for this project?  Let’s assume that the Volt product owner, whom we will call “Jay”, created the following statement:

For:    Automobile drivers

Who:  desire a clean, efficient method of transportation

The:   Chevy Volt

Is a:    hybrid motor vehicle

That: is propelled by an electric motor and can go 35 miles on battery power

Unlike: the Nissan Leaf which is limited to 70 miles of range per charge

Our:   product has an onboard gas engine that can act as a generator for the electric motor and extend driving range by 340 miles

And

Unlike: The Tesla Roadster which costs $109,000

Our:   product only costs $32,000 after government rebates

Tesla Roadster

If a product owner creates an elevator statement on their own, I will have them vet the statement with a small subset of the project team.  This small team is often composed of a development lead, a test lead, a UX lead, and an architect. The small team will try to identify holes in the elevator statement and issues that the product owner overlooked.

Simulating an Elevator Statement Team Evaluation
Let’s pretend the following happened at Chevy when Jay reviewed the elevator statement with the small team:

Keith the architect points out missing infrastructure.  The Volt owner will need to install a charger in their home, at a cost of approximately $2000.  To get a charger the owner will need to go through an assessment of their garage, obtain a permit for charger installation, do the installation, then have the installation inspected and approved.  Not quite as easy as buying a gasoline car.

Laura the QA lead thinks that die-hard green technology enthusiasts will buy the Volt even if they have to install a charger.  However, Laura has concerns of her own.  Laura notices that the Volt may have a high Total Cost of Ownership (TCO).  Here is Laura’s hypothesis:

If a person buys a Chevy Volt they will spend $32,000 for the initial purchase plus $2000 for a charger. Each charging of the Volt will cost approximately $1.50 on the electricity bill.  The $1.50 of electricity is good for 35 miles of range.  Continuing with this cost of ownership hypothesis, Laura says the average person drives 15,000 per year, and they keep a car for 5 years before selling and trading it.

Summing all of the items above, Laura determines that the total cost of owning a Volt for 5 years would be:

$32,000(car) + $2,000 (charger) + ($642 (electricity cost per year) x 5 years) = $37,210 

To give this perspective, Laura asks Jay to compare the Volt to a gasoline car that Chevy sells, the Chevy Cruze eco. The Chevy Cruze has a price of $16,800.  If the average person drives 15,000 miles per year, and gas costs as much as $5 per gallon, the total cost of owning a Cruze for 5 years will be:

$16,800 (car) + ($1785 (gas cost per year) x 5 years) = $25,728 

Laura concludes her point by saying a person could get a nice car plus a nice motorcycle (a new Suzuki GS 1000) for the cost of a Volt.

Chevy Cruze

Scott the developer does not want to pile on to the negatives, but he has his own point for Jay.  How long are the batteries good for?  Jay says the batteries are warrantied for 8 years, and right now he guesses a replacement battery pack will cost $3,500 in the year 2020.

Summarizing the Value of Elevator Statements
Let’s leave the simulation and reflect on the main goals of an elevator statement.  Here are 5 reasons I use elevator statements with my project teams:

  1. If you cannot concisely describe why you are doing a project, you have an immediate red flag.
  2. An elevator statement is a great tool to be reviewed by a small group for feasibility.
  3. An elevator statement review with a project team is a great way to get project buy-in.  Most teams are just told to build something.  Teams are not usually asked if they would approve of a project.  Involving the team in feasibility helps build passion and support for a project.
  4. An elevator statement review is cheap and can help you decide to cancel a project before going into an expensive and detailed ROI analysis.
  5. Elevator statements help the team design the product.  By knowing why we are doing a project, we can tailor the design and tradeoffs for the main business goal.

In summary, I am a huge fan of the elevator statement and use them with all of my clients and projects.

*Important disclaimer.  The author owns a Chevrolet product and was in favor of government support to keep GM going during the recession.  This blog post questions the process used to justify the Volt, but makes no comment on GM as a company or the Volt as a product.
Posted in Agile Practices, Uncategorized | Leave a comment

The Problem with Red, Yellow, Green Project Status

Many years ago I worked in a Project Management Office at a large financial institution. Once a week I prepared a project status report for executive management and the PMO director. I would calculate how we were tracking to budget, list any major issues or risks, and summarize overall status.

I was also told to mark the project as red, yellow, or green – using the following definitions:
Red: Serious issues and the project will probably be delayed or have significant budget overrun.
Yellow: Potential issues with schedule or budget, but both can probably be saved with corrective actions.
Green: On schedule, on budget, all good.

The red/yellow/green approach seems simple and logical. You only worry stakeholders if something goes wrong, so green projects do not need much review or attention.

However, in my experience the color approach has many shortcomings and potential repercussions. Let’s look at few.

Expectations
What happens when a green project turns yellow or red? In my experience there is an emotional conversation with stakeholders. Here are some of comments I frequently hear when a project goes from green to yellow:

“What went wrong?”, “Why didn’t you manage this project better?, “How can we avoid this happening again?”, “Why didn’t you see this coming?”.

As a project manager I often feel great guilt with these conversations and I too question my competency. But if we spend a moment and work our way through the guilt and emotion, we can see this issue from a more analytical perspective.

Not in line with normal project uncertainty
You may be familiar with the cone of uncertainty. The cone of uncertainty tells us that you cannot completely understand all of the tasks and potential issues within a project, at the beginning of a project. As the project progresses we learn more and there are less risks, but we can never anticipate everything that could go wrong until the project is 100% complete.
When we label a project as green we are telling the sponsor everything is OK, today.
Sponsors interpret green as everything is OK today and it should be for the entire project. It is human nature to assume the project is under control and should stay under control.

A Different Approach
But since any experienced project manager knows that green does not necessarily mean green forever, we need to speak in verbiage that stakeholders can relate to. To address this issue I have changed my color scheme when working with sponsors and removed green from my status options.

My options are now:
Yellow: The project does not have any known issues but there is still high risk that something could go wrong (as demonstrated by the cone of uncertainty). As with any project in flight, we are managing it cautiously and we are doing our best to deliver successfully.
Orange: An issue has surfaced and the project goals are in jeopardy. We are triaging the issue(s) and at this time we believe we can still be successful
Red: An issue has surfaced and we do not believe 100% project success can be obtained due to the discovery. More than likely we will either miss the desired date, or exceed budget, or not be able to deliver the desired scope by the target date.

Conclusion
What do you think of my approach? I welcome your thoughts. I know many stakeholders will “freak-out” at seeing no greens, but I believe all projects are yellow until they are delivered.  We need to teach stakeholders that this a reality of doing business.

Posted in Uncategorized | 24 Comments

The Story of the Good King and the Bad King

James was the prince of Pragyle when his father became ill and passed the throne to James.  James had watched his father for years and knew what he would do when he became king.  James set out to make life better for the citizens of Pragyle.

James looked at the local roads.  He identified two bridges that were close to breaking and he instructed his carpenters to reinforce the bridges.  The citizens had no idea James’ maintenance work prevented a future disaster.

James looked at the budget for the coming year.  He could see that taxes would need to be raised to provide all of the services the kingdom had budgeted.  Instead of raising taxes, however, James met with the financial advisors of the kingdom.   They identified many projects that really weren’t that important, such as creating a painting of James on the side of the palace, or performing a research study on the quality of moat water. By cutting out the waste James avoided raising taxes, and the people of the kingdom never realized they had been saved from additional expense.

James monitored the kingdom next door, Wötterfal, on a daily basis.  He managed the risk of an impending war by watching every movement the Wötterfal troops made, and he warned them any time they approached the border of Pragyle.

Throughout James’ tenure, the people of Pragyle were solicited for their rating of James.  James always scored “good” on a scale of poor, fair, good, and great.

Unfortunately James died in his sleep after 10 years as the king of Pragyle.  James did not have any offspring and was replaced via election.  The people of Pragyle elected Eli the Plumber to replace James.

Eli took over and enjoyed all of the luxuries of being king.  He ordered lavish dinners, had his face painted on the side of the palace, and spent most of his time playing backgammon.  Eli thought to himself “Oh my, what an easy life James had.”

As time passed, Eli learned that running the kingdom was not all fun and games.  Soon one of the old bridges of the kingdom collapsed and 40 citizens plunged to their death.  Eli made a proclamation that the bridge would be rebuilt with better materials, and this would never happen again in the kingdom.  The citizens cheered Eli’s visionary thinking.

Next, Eli had a budget issue.  The new mural on the side of the palace was expensive and so were the lush parties.  Eli would have to reduce costs elsewhere in the kingdom, or increase taxes on the citizens.  Not wanting to be unpopular, Eli reduced the amount of monitoring that was occurring with the neighboring Kingdom of Wötterfal.  Instead of having surveillance soldiers watch Wötterfal every day, he reduced surveillance to once a month.  The citizens would still be happy because their taxes did not increase.

Unfortunately soldiers from Wötterfal crossed the border of Pragyle between the surveillance periods.  A farmer of Pragyle spotted the advancing troops and ran to the castle to warn Eli.

Eli quickly called the soldiers together and screamed for the soldiers to hastily gather their weapons and fight for the survival of Pragyle.  The soldiers were at a disadvantage since the Wötterfal soldiers were armed and ready to pounce.  After two weeks of fighting, and 900 soldier deaths, the Wötterfal army was repelled and Pragyle was saved.  The citizens chanted Eli’s name.  His stimulating speech had inspired the Pragyle army to save the day.  When the citizens were surveyed later that year, they gave Eli the ranking of “great” and they all mused how James had never suggested building a bridge with better materials, or how he had never helped rescue them from the Wötterfal army.

How does this relate to software projects?  How often do you reward the developer who saves the day at the end of a project, when they end up fixing a bug of their own making? How often do you reward the developer who kept their work on track throughout the project, and did not need a fire drill at the end of the release?

We all like heroes like Captain “Sully” Sullenberger, who lands a flight on the Hudson after running into a flock of birds. But how much recognition would a ground controller have received if they had directed Sully’s plane to a different location and avoided the disaster all together?

Be successful on your agile projects.  Recognize the people who prevent disasters, not just those who save you from them.

Posted in Agile Adoption | 1 Comment